Stop guessing at your audience. Every connection to your stream is tracked for you, with no analytics tag to add and no spreadsheet to keep. Open your dashboard for the live view and the history behind it. It's free with every CastHost plan.

1,284
listeners right now
38m
average session
42
countries
2,914
listeners today
Illustration of live listener stats
Radio station analytics that go beyond a listener count
Live listener count
See who's connected this second: location, device and how long they've been listening, and watch it move as people tune in and drop off.
Where they're listening
Break your audience down by country, by sessions and by minutes listened, so you know which places tune in most and which ones stay longest.
Session length & hours
Total listening hours, unique listeners and average session time, plus a breakdown of how long people stay, from listeners who drop in for a minute to ones who leave it on all day.
Top tracks & airtime
Rank your songs by plays and by total airtime, with your peak track and peak time, so you can see what fills your rotation.
Devices & clients
See the players, apps and browsers your audience uses, with crawlers listed on their own line so you can tell them apart.
Trends over time
Switch between 7, 14 and 30-day views or a custom range, and follow your listener trend to see when your audience actually shows up.
The whole picture, from one dashboard
See your most-played tracks

Your track report shows exactly what your station has been playing: how many times each song played, how much airtime it pulled, your peak track and your peak listening time.

  • Top tracks by playbacks and by airtime
  • Peak listeners, peak track and peak time
  • Total plays, unique tracks and average length
CastHost track statistics dashboard showing total plays, average per hour, peak track and top tracks by playbacks and airtime
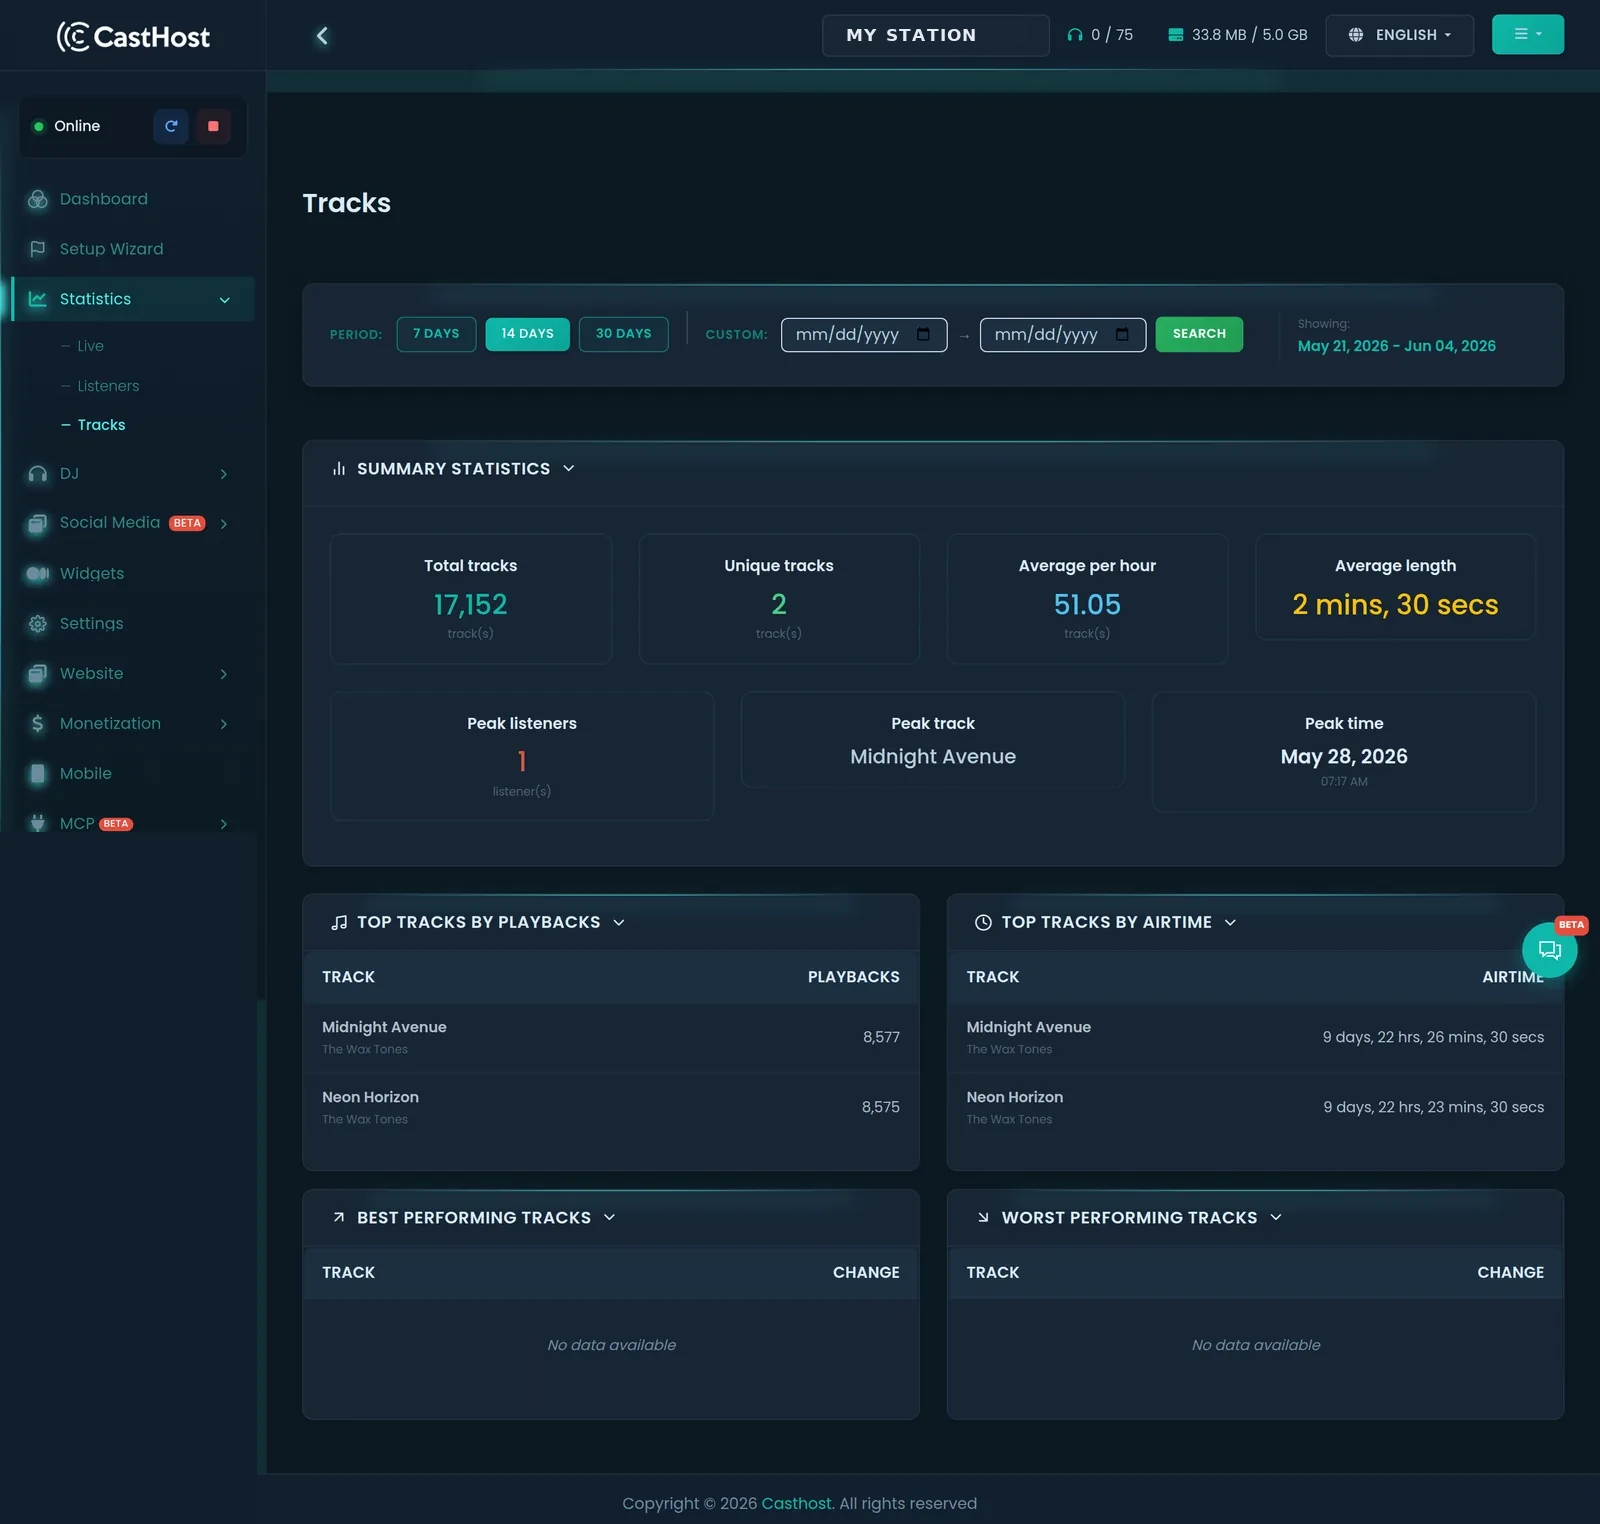
The track report (demo data shown)
Nothing to set up, it's already counting

Go live

Start your stream on Shoutcast or Icecast as usual. There's no analytics tag to add and no separate tool to wire up.

Every listen is tracked

As people connect, CastHost records the session: location, device, how long they stayed and what was playing.

Read the reports

Open your dashboard for the live view and historical reports, and use what you learn to shape your schedule and rotation.

Your listener stats, answered

Yes. The live view shows who's connected right now, where they are and how long they've been listening, and refreshes as listeners come and go. Alongside it you get historical reports so you can see how today compares with the last two weeks.

Listener locations are shown by country, both by number of sessions and by minutes listened, so you can see which places are tuning in most and which are sticking around the longest.

Switch between 7, 14 and 30-day views or set a custom date range, and follow your listener trend over time to see when your audience shows up.

Yes. Whether your station runs on Shoutcast or Icecast, listener connections and play history are tracked automatically, with nothing to install or tag. The stats are simply there in your dashboard.

Each connection to your stream is counted as a session, with its location, client and listening time. Clients and user agents are listed separately too, so you can see which players, apps and crawlers are connecting.

Yes. The track report ranks your songs by number of plays and by total airtime, and shows your peak track and peak listening time, so you can see what fills your rotation.
Explore the rest of your dashboard

See who's really listening

Real-time and historical listener statistics come free with every CastHost plan, with no analytics add-on to buy. Start a plan, go live, and watch your first numbers come in.

Start free trial See plans
Get in Touch

Send us a message